This week's tip is from Robert Carver and his book Practical Data Analysis with JMP. If you're a JMP user, be sure to take a look at additional bonus content from the book.
The following excerpt is from SAS Press author Robert Carver and his book "Practical Data Analysis with JMP". Copyright © 2010, SAS Institute Inc., Cary, North Carolina, USA. ALL RIGHTS RESERVED. (please note that results may vary depending on your version of SAS software)
Using JMP to Conduct a Significance Test
Suppose that there were a national goal of restoring the areas to safe conditions in less than three hours (180 minutes) on average, and we wanted to ask if this goal has been met. We could use this data table to test the following hypotheses:
Ho: μ ≥ 180 [null hypothesis: the goal has not been met]
Ha: μ < 180 [alternative hypothesis: the goal has been met]
6. Click on the red triangle next to STMin, and select Test Mean. This opens the dialog box shown in Figure 9.4. Type 180 as shown and click OK.
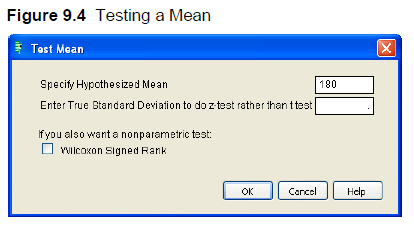
Notice that the dialog box has two optional inputs. First, there is a field into which you can “Enter True Standard Deviation to do z-test rather than t-test.” In an introductory statistics course, one might encounter a textbook problem that provides the population standard deviation, and therefore one could base a test on the Normal distribution (that is, conduct a z-test) rather than the t-distribution. Such problems might have instructional use, but realistically one never knows the population standard deviation. The option to use the z-test has virtually no practical applications except possibly when one uses simulated data.
The second option in the dialog box is for the Wilcoxon Signed Rank test; we’ll discuss that test briefly in the next section. First, let’s look at the results of the t-test.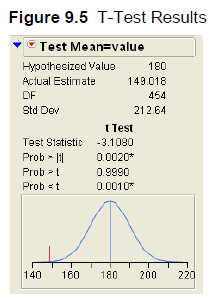
In the test report, we find that this test compares a hypothesized value of 180 minutes to an observed sample mean of 149.018, using a t-distribution with 454 degrees of freedom. The sample standard deviation is 212.64 minutes.
We then find the Test Statistic, computed by the following formula: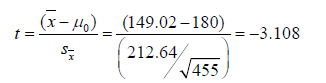
Below the test statistic are three P-values, corresponding to the three possible formulations of the alternative hypothesis. We are doing a less-than test, so we’re interested in the last value shown: 0.0010. This probability value is so small that we should reject the null hypothesis. In view of the observed sample mean, it is not plausible to believe that the population mean is 180 or higher. The graph at the bottom of the panel depicts the situation. Under the null hypothesis that the population mean is truly 180 minutes, the blue curve shows the likely values of sample means. Our observed sample mean is marked by the red line, which sits –3.1 standard errors to the left of 180. If the null hypothesis were true, we’re very unlikely to see a sample mean like the one we’ve observed.


